Did you know that there is a popular myth that storks deliver babies? This claim is often supported by faulty statistical arguments, leading many people to be cautious of statistics in general. However, statistics play a crucial role in uncovering important facts, such as the link between smoking and lung cancer or the transmission of COVID-19.
The book includes key ideas like
Did you know that there is a popular myth that storks deliver babies? This claim is often supported by faulty statistical arguments, leading many people to be cautious of statistics in general. However, statistics play a crucial role in uncovering important facts, such as the link between smoking and lung cancer or the transmission of COVID-19.
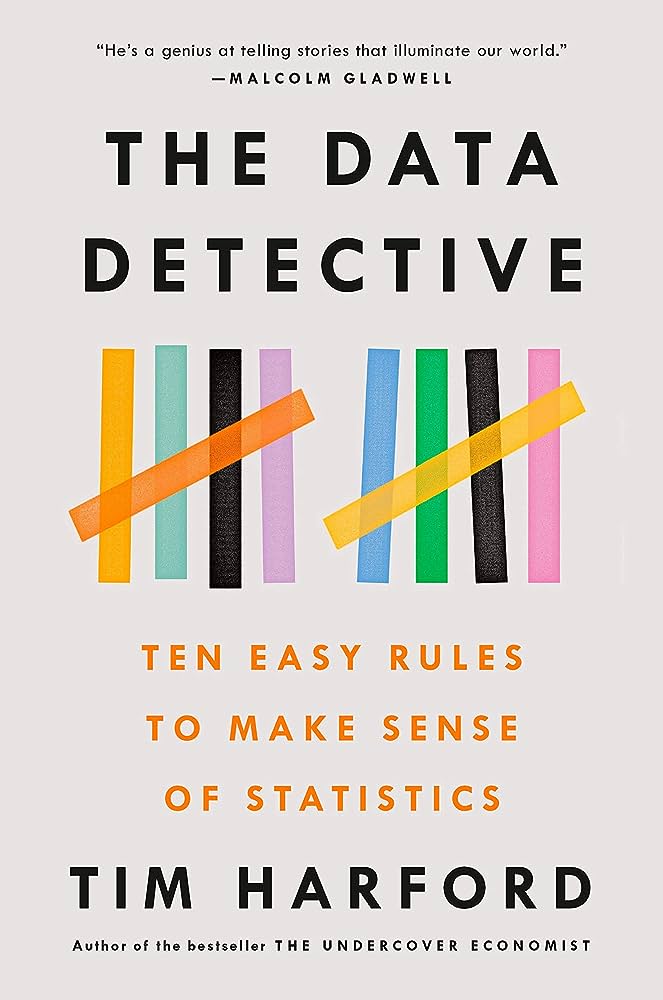
This book aims to provide readers with ten strategies to better understand statistics, allowing them to differentiate between accurate and misleading information. By mastering these strategies, readers can confidently discern the valuable insights statistics offer while dismissing misleading interpretations.
The book includes key ideas like
Abraham Bredius, a prominent art critic, collector, and renowned expert on Dutch painters, had a strong focus on Johannes Vermeer, the esteemed seventeenth-century artist known for iconic works like Girl With a Pearl Earring.
In 1937, Gerard Boon, a lawyer, visited Bredius and presented him with a newly discovered Vermeer painting titled Christ at Emmaus. Bredius was immediately captivated by the painting, but he remained cautious. He carefully examined the artwork, searching for any signs of forgery, yet found none.
Convinced of its authenticity, Bredius confidently proclaimed Christ at Emmaus as a genuine Vermeer, possibly even his masterpiece. He expressed that the painting deeply moved him emotionally. However, Bredius’s heightened emotions ultimately led to his downfall since Christ at Emmaus was, in fact, a complete forgery.
The key lesson here is to be mindful of our emotional reactions when encountering data and information.
Even though Emmaus was not considered a remarkable painting, Bredius was deceived due to his strong desire to believe in its authenticity as a genuine Vermeer, which clouded his logical judgment. Unfortunately, this tendency to be fooled by emotions applies to most people when they encounter emotionally charged information.
While certain statistics might not evoke emotional reactions – such as “Mars is more than 30 million miles away from Earth” – other topics, especially political ones, can easily trigger strong emotions in us. In such cases, we tend to either ignore information that contradicts our existing beliefs or selectively use it as evidence to support our views. Surprisingly, even experts can fall into this trap, as studies have shown that they are also reluctant to change their opinions in the face of conflicting evidence. This is partly due to their motivation to avoid uncomfortable information and their ability to craft arguments favoring their own perspectives.
Motivated reasoning affects everyone, but there are simple protocols that can help reduce its influence. The process begins by recognizing how you feel when confronted with a statistical claim – whether you feel outraged, joyful, or in denial. After identifying your emotional response, take a moment to pause and reflect on whether you might be exerting extra effort to reach a specific conclusion. By committing to objectively assess the facts, you can enhance your clarity of thought and set an example of clear thinking for others.
Upon securing a position as a presenter on a BBC radio show, the author developed a deep affection for the job. However, the daily morning commute from East to West London was an aspect he didn’t relish. His route involved navigating through a crowded bus and an overly packed subway train (tube). This led him to become curious about the actual congestion of London’s public transport system. To his astonishment, he discovered that the average occupancy of a London bus was merely 12 people, and on the tube, it was less than 130 passengers.
These statistics felt incredibly counterintuitive and contradicted the author’s firsthand experience of the overcrowded transportation.
This raises an essential point: It’s crucial to understand when to place trust in a statistical claim versus personal experiences.
We are aware that our personal beliefs and emotions can sometimes skew our interpretation of statistical claims. Nevertheless, personal experiences can also hold valuable insights, and finding a balance between the two is essential. To gauge the credibility of a statistical claim, we must examine its source. In the case of London’s public transport data, it originated from a government organization called Transport for London (TfL), which gathers information from payment cards used by passengers before boarding.
Next, we should understand why personal experiences, like the author’s, may differ from the statistics. Calculating averages plays a significant role here. For instance, on a train line with ten trains daily, if one train carries a thousand passengers and the other nine have zero passengers, the average occupancy per train would be 100 people, aligning closely with London’s real average. Thus, TfL’s statistics were accurate, but they didn’t account for the personal experiences of those crammed into the overcrowded trains. In certain situations, statistics or personal experience may be more appropriate. Statistics are often favored in health-related matters, as they provide insights into the most probable outcomes for a larger population. For instance, despite a 90-year-old chain-smoking grandmother doing well, statistics show that cigarette smoking still increases the likelihood of lung cancer by 16 times.
However, statistics can also be misleading, particularly in scenarios like performance reviews. People are more likely to manipulate, falsify, or distort data when financial or professional gains are involved, making individualized performance evaluation preferable. Achieving genuine understanding involves recognizing when statistics, personal experiences, or a combination of both are most relevant and informative.
During the late 2010s, the UK faced a perceived crisis of infant mortality, with varying death rates across the country, but the reasons were not initially clear. Eventually, it was discovered that the disparity in mortality rates was due to differences in how certain cases were defined. Specifically, whether a baby born at 22 or 23 weeks should be classified as a miscarriage or a live birth followed by an early death. Hospitals in London recorded these pregnancies as miscarriages, while hospitals in the English Midlands considered them live births. This discrepancy explained the gap in mortality rates between the two regions.
This story emphasizes the importance of understanding what a statistic truly represents beyond its surface interpretation. The key takeaway is to carefully scrutinize what a statistic is measuring.
The key message is this: Carefully consider what a statistic is actually measuring.
While measuring something like infant mortality may seem straightforward at first – by counting the babies who died – delving deeper into the distinction between a fetus and a baby can make it more complex and contentious.
When encountering statistics, we often fail to question who or what is being counted. For instance, the claim that children who play violent video games are more likely to be violent in reality raises questions about what qualifies as a violent video game, how frequently the children play, and how researchers measure violence.
The ambiguity in definitions can be exploited by those seeking to distort facts, possibly to advance specific political viewpoints. For example, a policy proposal for a “five-year freeze on unskilled immigration” could encompass a broad range of professions, including nurses, primary school teachers, paralegals, and pharmacists, depending on the definition of “unskilled.”
Therefore, it is crucial to question the definitions used in a claim before accepting or refuting it. When claims are made about rising inequality, it’s essential to ask: inequality of what exactly?
Startling headlines emerged from London’s newspapers in April 2018, all proclaiming that “London’s Murder Rate is Higher Than New York’s for the First Time Ever!” However, before drawing conclusions, we must consider the broader context and perspective from which the data is presented.
Technically, the claim was true, with 15 murders in London compared to 14 in New York City in February 2018. But this raw number alone doesn’t provide meaningful insights. To grasp the real situation, we need to look at the historical context.
In 1990, London had 184 murders, while New York had more than ten times that number, with 2,262 murders. Since then, both cities have experienced a decline in murder rates. In 2017, London had 130 total murders, and New York had 292, showing significant improvements in safety for both cities.
The key message here is: Put claims into context before you draw conclusions.
With this broader perspective, we understand that occasional fluctuations in murder rates may occur due to varying crime patterns, but neither city has suddenly descended into chaos. Instead, both London and New York have become safer over time.
The news media’s focus on immediate, momentary events often obscures the bigger picture. To gain a better understanding of statistical significance, it’s helpful to consider broader time scales. News presented over a 25-year basis might highlight major developments like the rise of the World Wide Web or China’s emergence as a global power, rather than isolated monthly murder rates.
Additionally, placing numbers within broader numerical scales can provide better context. For example, the proposed cost of the US-Mexico border wall at $25 billion might seem substantial, but when compared to the entire US defense budget of nearly $700 billion annually or about $2 billion per day, it becomes evident that the wall’s cost is relatively smaller.
Ultimately, comprehending the full context allows for better-informed opinions, even if one still views certain statistics, like the cost of the border wall or murder rates in London, as reasons for concern.
Have you heard about the well-known jam-tasting experiment conducted by psychologists Sheena Iyengar and Mark Lepper? In this study, the researchers set up a jam-tasting stall that alternately offered 24 varieties of jam and only six. After tasting the jam, customers were given a voucher to purchase it at a discount. Surprisingly, the bigger display attracted more customers, but only three percent of them ended up buying the jam, whereas 30 percent of customers from the smaller display made a purchase. The psychologists concluded that people respond better to fewer choices and worse to more choices.
Since its publication, the study has garnered significant attention, appearing in various sources such as pop-psychology articles and TED Talks. However, the reliability of its findings comes into question due to potential biases influencing scientific research.
The research on choice is much more inconclusive than the original jam study suggests.
Published papers on the topic varied, some finding a substantial positive or negative effect of offering many choices, while others found no effect at all. The average effect, when considering all results, turned out to be zero.
Academic publications are susceptible to biases, similar to those found in news media. One such bias is publication bias, where journals tend to publish studies with surprising or counterintuitive results over inconclusive ones. This preference for exciting findings can influence the perception of the topic.
Moreover, researchers’ careers and incomes often rely on their ability to conduct and publish research. This can create incentives for them to manipulate data to make their studies seem more significant than they are, leading to a “replication crisis” in the social sciences, where many prominent studies fail to be replicated.
Considering the trustworthiness of a study before touting its results is essential. Intuitively evaluating the study’s findings and checking if similar conclusions are drawn in many other studies can help avoid spreading misleading or incorrect information. Until these issues are addressed, caution is necessary when interpreting and sharing scientific research.
To what extent do individuals feel pressured to conform to their peers? Extensive research suggests that the answer is: quite a lot.
In the 1950s, psychologist Solomon Asch conducted a captivating study where subjects were shown two images: one with three lines of different lengths and the other with a “reference line.” Their task was to identify which of the three lines matched the reference line in length. However, the subjects were surrounded by “plants” – people intentionally selecting the wrong line. The subjects’ choices were significantly influenced by the errors of their peers.
While Asch’s experiments were compelling, we must be cautious in generalizing his findings to all of humanity. His research was limited to a specific population: white, male American college students from the 1950s.
The key takeaway is that statistics and data may not apply equally to everyone.
Today, psychologists recognize the issue of limited research in specific populations, often termed “WEIRD” (Western, Educated, and from Industrialized Rich Democracies). Such studies may not fully represent the diversity of human experiences.
Although Asch’s conclusions have been backed by numerous follow-up studies, these studies often lack diversity as well. However, some intriguing effects emerged in diverse samples, such as people being more likely to conform with friends than strangers, and women being more susceptible to conformity than men.
Academic research should ideally have a representative sample of the population, but achieving this can be challenging in areas like polling. Polls may suffer from sample bias, where certain groups are more likely to respond than others. Additionally, the source of the data can influence the representation; for instance, polls of American Twitter users may overrepresent young, college-educated individuals.
Always keep these considerations in mind when encountering data and ask yourself: Who might be missing from this sample? Investigating such blind spots can lead to a more accurate understanding of the data’s implications.
In 2009, Google Flu Trends was introduced as a groundbreaking tool to track the spread of seasonal influenza. Utilizing data from searches for terms like “flu symptoms” and “pharmacies near me,” Google claimed it could accurately estimate new daily flu cases faster than the CDC.
Google Flu Trends represented the dawn of a new era, marked by “big data” and algorithms. Big data encompasses the vast information generated when we browse the internet, use credit cards, or interact with mobile phones. Algorithms are computer programs designed to identify patterns within datasets.
The combination of big data and algorithms seemed promising for producing accurate flu trend data. However, only four years after its launch, Google Flu Trends experienced a total collapse. The reasons for this abrupt failure remain to be explored.
The key message here is: Maintain a healthy skepticism of algorithms and big data.
Google Flu Trends faced a major setback when it wrongly indicated a severe flu outbreak that didn’t actually exist. At one point, its estimates were twice as high as the official CDC data, leading to doubts about its accuracy.
The main issue stemmed from Google’s lack of understanding regarding the connection between search terms and the spread of flu. The algorithm attempted to identify patterns in the data but ended up finding irrelevant connections, like “high school basketball,” making it more of a general winter detector rather than a reliable flu detector. This limitation prevented it from detecting a summer flu outbreak in 2009.
Despite the shortcomings, there are instances where trusting algorithms over human-produced estimates is beneficial. For example, algorithms have shown to be more consistent and objective in determining criminal sentences by comparing past cases.
However, it is essential to assess each algorithm individually, as their accuracy can vary. Many companies are reluctant to disclose the inner workings of their algorithms, but transparency can lead to a better understanding of their decision-making process and potential improvements. Evaluating algorithms on a case-by-case basis can help ensure their reliability and effectiveness.
In 1974, the Congressional Budget Office (CBO) was established in the US to provide Congress with unbiased reports on the budgetary costs of policy proposals. A CBO official described the process as delivering a bill down into a manhole and receiving cost estimates back up within 20 minutes – a process that aimed to be objective and noncontroversial.
However, not every president gracefully accepted the CBO’s estimates. Jimmy Carter, for instance, sought to improve America’s energy efficiency, but the CBO evaluated his proposals and concluded that they wouldn’t work as well as intended. The Carter administration was dissatisfied with the CBO’s findings because they didn’t align with their goals. Nevertheless, the primary purpose of esteemed government organizations is to present statistics accurately, regardless of whether they please politicians or not.
Here’s the key message: Don’t dismiss the importance and usefulness of official statistics.
Distorting or discrediting the work of statistical agencies can lead to disastrous consequences, as seen in the case of Greece. In the early 2000s, Greece’s official statistics were highly unreliable, as officials manipulated the numbers to meet eurozone requirements. This deception was exposed during the global financial crisis in 2009, revealing the country’s unsustainable borrowing and leading to a severe economic collapse.
Independent statistical agencies play a crucial role in keeping a country accountable and honest. They are not only essential for data accuracy but also prove to be beneficial in various aspects. For example, a cost-benefit analysis in the UK demonstrated that data from the national census contributed significantly to policymaking related to pensions, infrastructure development, and various per-capita statistics. While quantifying all the statistical benefits precisely proved challenging, a conservative estimate indicated measurable benefits of £500 million per year, far exceeding the cost of the census itself.
In essence, robust and reliable statistical data provided by independent agencies are vital for governments to make informed decisions and effectively address critical issues.
David McCandless, the author of Information is Beautiful, created an eye-catching animation called Debtris, reminiscent of the classic game Tetris. In Debtris, large colored blocks fall to the bottom of the screen, each representing the cost of different items, such as the UN budget, the estimated cost of the 2003 Iraq war, and Walmart’s revenue.
The animation is visually appealing, accompanied by catchy music and vibrant graphics, making it captivating to watch. However, beneath its beauty lies the issue that the data used to create the graphic has many problems and limitations.
The key message is this: Don’t be fooled by the slick aesthetics of a graph or chart.
At times, visually presenting statistics can be aesthetically pleasing, but the data supporting it may be flawed, as is the case with Debtris, which contains various mistakes like conflating net measures with gross measures, akin to comparing a company’s profit with its turnover.
However, this doesn’t mean we should entirely abandon the idea of presenting data beautifully. In some instances, a balance can be struck between visual appeal and informativeness. Florence Nightingale, renowned as the founder of modern nursing, also made significant contributions as a statistician. In 1858, she introduced the rose diagram to demonstrate that sanitary measures could reduce deaths from infectious diseases, a concept not well understood at the time. The rose diagram visually portrayed the impact of sanitation measures by showing the number of deaths before and after their implementation, effectively persuading hesitant doctors and leading to the passage of public health acts.
To avoid being misled by misleading graphs and charts, it’s essential to approach them with the same critical mindset as any other data. Take note of your emotional response, understand the underlying meaning of the graph, and recognize that someone may be trying to persuade you of a particular viewpoint – a tactic that can be acceptable in some cases.
Philip Tetlock, a young psychologist originally from Canada, was part of a team of social scientists tasked with the critical mission of preventing nuclear war between the US and the Soviet Union. To achieve this goal, Tetlock conducted numerous interviews with various experts, seeking their insights on the potential outcomes and reasons behind them.
However, Tetlock became frustrated as he observed that experts, regardless of their backgrounds, were exceptionally stubborn and resistant to changing their opinions, even when presented with contradictory evidence. Additionally, many of them persistently tried to defend their past inaccurate predictions. To expose the flaws in their forecasting abilities, Tetlock designed a clever study that vividly demonstrated the extent of their shortcomings.
The key message here is: Always keep an open mind and be willing to revise your opinions.
Tetlock’s experiment involved gathering approximately 27,500 predictions from nearly 300 experts in politics, geopolitics, and to some extent, economics. He formulated clear questions with definite true or false outcomes in the future, and then patiently waited for 18 years to observe the results.
In 2005, Tetlock published his findings, revealing a straightforward and striking conclusion: experts were exceedingly poor forecasters. Their predictions were incorrect, marked by overconfidence, and they tended to selectively misremember their forecasts, claiming correctness when the records showed otherwise.
However, Tetlock didn’t attribute these forecasting failures to the complexity of the world. To further explore the matter, he launched another ambitious study that incorporated the insights of 20,000 experts and amateurs alike.
Interestingly, this subsequent study revealed that certain individuals were indeed better than others at making predictions – not flawless, but consistently above average. Moreover, these individuals, referred to as “superforecasters,” improved their forecasting abilities over time, indicating that their initial success wasn’t merely due to chance.
The key quality uniting the superforecasters was their open-mindedness. They were willing to adapt their perspectives and change their views in light of new evidence, rather than rigidly adhering to a specific forecasting approach.
Tetlock’s research demonstrates that our shortcomings in statistical predictions arise less from inadequate knowledge and more from our reluctance to embrace new data. Therefore, cultivating an open mind, combined with a solid understanding of statistics, can significantly enhance our comprehension of the world.
The main takeaway from this book is to approach data with an open mind and a focus on the facts, guided by several essential principles.
Firstly, pay attention to your emotional reactions when encountering information, whether it’s presented visually or verbally, and be willing to update your beliefs based on new evidence. Secondly, always consider the broader context surrounding a statistic, being mindful of potential distortions, exclusions, or oversights. The overarching aim is to cultivate curiosity, delving deep into the facts and continuously asking questions.
For practical advice, entrepreneur Andrew Elliott suggests memorizing a few “landmark numbers.” These are key figures that serve as reference points to understand the relative significance of other numbers. For example, knowing the population of the United States (325 million) or the UK (65 million), the distance from Boston to Seattle (3,000 miles), or the average novel’s word count (100,000 words) can help you make comparisons and grasp the scale of other measurements. By internalizing these landmarks, you can easily assess the magnitude of different figures, facilitating better understanding and analysis.